Insights · Healthcare
How Small Healthcare Networks Turn Scattered Data Into Decisions, Without a Data Team
You already own the data. The real gap is turning it into decisions your leadership can make every week, without hiring a data team.

Walk into most small or mid-size healthcare networks and you’ll find the same thing, an EHR, a practice-management system, a scheduler, a billing tool, a marketing platform, and a stack of dashboards nobody quite trusts.
There is no shortage of data. There’s a shortage of decisions that data actually changes. Leadership still walks into the Monday meeting and runs the network on instinct, because pulling a clean, comparable picture across every location takes days , and by the time it’s ready, it’s stale.
The instinct is to hire an analyst or buy a bigger platform. For a network this size, both are usually the wrong move. Here’s what works instead.
The problem was never a lack of data. It’s the gap between the data you have and the decisions it should be driving.
Why a data team isn’t the answer
A single experienced data hire runs six figures a year, takes months to ramp, and needs managing by someone who already speaks the language. A new enterprise platform means a migration, a training rollout, and a contract you’ll be explaining to the board for years.
You’re in the middle, too big for spreadsheets, too small to justify Epic-tier tooling and a full analytics function. The good news is you don’t need either. You need the right handful of numbers, pulled from the systems you already pay for, in front of leadership every week.
The five numbers to see every week
Dashboards fail because they show everything. The networks that grow fastest watch a short list and act on it. If you track nothing else, track these, each one exists to catch a specific, expensive problem early.
Net revenue vs. plan, by location
Surfaces the underperforming site while you can still act on it, not when the quarter closes.
Days in A/R and denial rate
Shows revenue stuck or quietly lost in billing, from unworked claims and underpayments to rising denials.
Provider utilization and no-show rate
Turns empty chairs and open slots, the capacity you're paying for but not filling, into a number.
New vs. active patients and reactivations
Flags attrition early, before it shows up as a soft month in patient volume.
Contribution margin per location
Separates the site that's busy from the site that's actually profitable.
From six systems to one weekly read
None of these numbers live in one place. Revenue is in billing, utilization is in scheduling, retention is buried in the EHR, and marketing spend is in a fourth tool. The work isn’t collecting more data, it’s connecting what you already have into a single, trusted view.
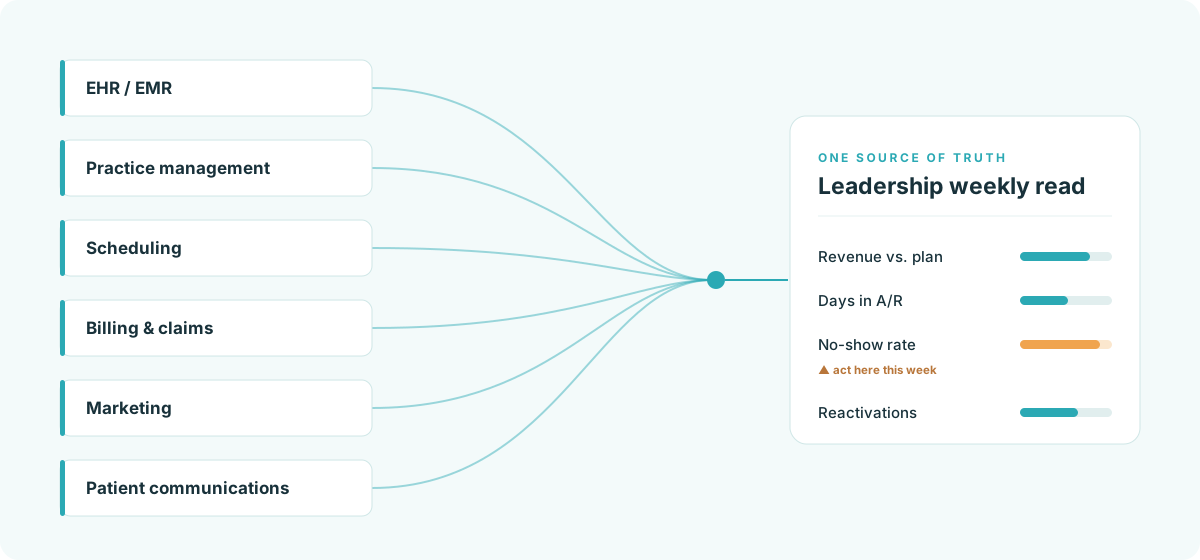
Done well, this is a short, plain-language summary, not another dashboard to log into. It shows what changed, why it matters, and the one or two things worth leadership’s attention this week. That is the entire point, fewer, sharper numbers that lead to action.
Where to start
Don’t start with tooling. Start with the decisions your leadership team actually makes each month, then work backward to the handful of numbers that should drive them. Pick the two most painful , usually revenue leakage and utilization, and get those visible and trustworthy first. Momentum comes from a fast, honest picture, not a six-month build.
From there, the same foundation extends naturally, with connected reporting, then lightweight automation and AI where it genuinely saves time. Strategy first. Dashboards second.
See where your revenue is leaking, free
Start with a free Revenue & Operations Clarity Audit. No cost, no commitment, just an honest look at where revenue is slipping and what to fix first.
Book Your Free Clarity AuditJoin the conversation
Running a healthcare network? Tell us which of the five numbers is hardest to see today, and what you'd add to the list.
Loading comments…